


This article is also available in Spanish.
Although Bitcoin (BTC) remains range-bound (trading between the $90,000 and $100,000 price levels), some crypto analysts predict a price correction can be on the horizon due to a bearish ‘head and shoulders’ pattern forming on the daily chart.
Will Bitcoin fall to $80,000?
Seasoned analyst and trader Aksel Kibar took to X to share his thoughts on the recent BTC price action. in your mailThe authoritative market technician highlighted a possible head and shoulders pattern forming on the daily BTC chart, with the risk of the cryptocurrency falling as low as $80,000.
The analyst explained that the pullback could take BTC price into the widening pattern that was completed with a break above $73,600. However, Kibar emphasized that the head and shoulders pattern must fully materialize for a significant pullback in BTC price to occur. He stated:
Seeing it is not enough. It should be materialized with an opening below the neckline. There are many cases of failed head and shoulders highs, especially in consistent uptrends well above the yearly average.
Other crypto analysts have also shared similar bearish outlooks for the price of Bitcoin. For example, technical analyst Ali Martínez identified $92,730 as a crucial price level for the leading cryptocurrency. According to Martínez, losing this level could push BTC into “free fall territory,” based on the realized price distribution (URPD) of UTXO.
Related reading
For the uninitiated, URPD is a metric that shows the distribution of Bitcoin’s unspent transaction results (UTXO) at various price levels, based on when they last moved. Basically, it helps identify price zones where significant BTC accumulation or spending occurred, providing insights into investor behavior and market sentiment.
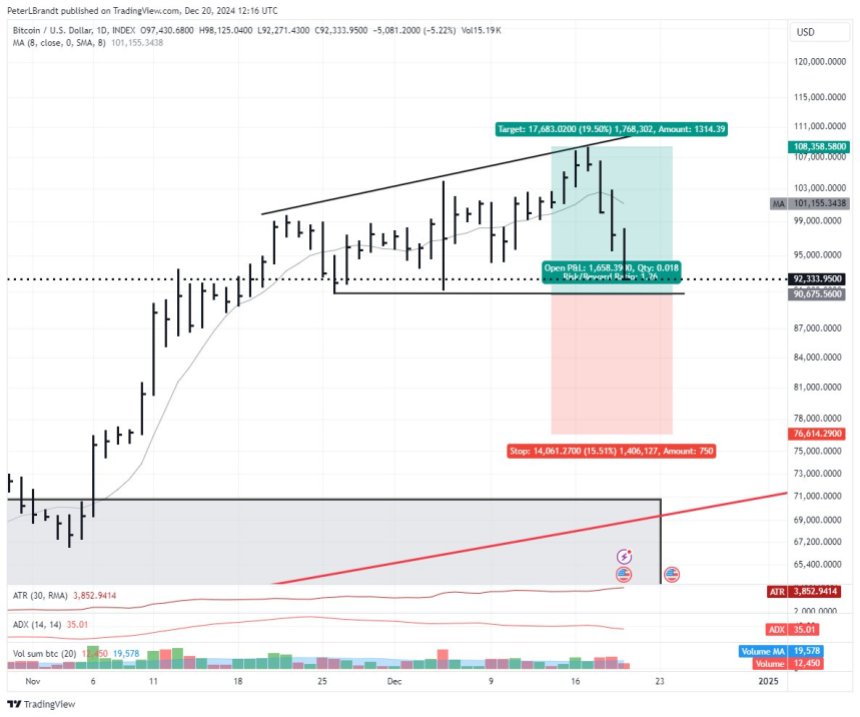
Additionally, former Wall Street derivatives trader Tone Vays warned that BTC trading below the $95,000 price level would be “very, very bad” for the flagship digital asset. Likewise, renowned trader Peter Brandt recently highlighted the risk of BTC breaking out of a “widening triangle” formation, potentially falling to the $70,000 level.
While several analysts predict a possible price correction, others remain optimistic about Bitcoin’s long-term trajectory. Thomas Lee of Fundstrat Capital projected that BTC could rise as high as $250,000 by 2025. However, he acknowledged the possibility of a short-term correction to $60,000 early next year before Bitcoin enters a historic bull run.
The long-term bullish case for BTC
While BTC may face an imminent price correction according to some analysts, long-term price projections remain overwhelmingly bullish. Sygnum Crypto Asset Manager postulate that BTC may face “demand shocks” due to strong institutional interest in the asset, significantly driving up its price.
Related reading
Earlier this month, Alí Martínez highlighted the possible formation of a ‘cup and handle’ pattern on the BTC chart. If this pattern develops, it could trigger renewed bullish momentum for the digital asset. At press time, BTC is trading at $94,149, down 2.5% in the last 24 hours.

Featured image from Unsplash, X Charts and TradingView.com
