


Ripple (XRP) is at risk of falling below $2 after a 12% drop last week. This potential drop is highlighted by technical indicators identified in a recent XRP analysis, which point to increasing bearish pressure.
A few days ago, XRP rose to a yearly high of $2.73, sparking speculation of a return to $3. But that prediction could be delayed and here’s why.
Ripple loses control on the rise
The Relative Strength Index (RSI), which measures momentum, is an indicator that suggests the price of XRP could decline. The RSI also shows whether an asset is overbought or oversold. When the reading is above 70.00, it is overbought and when it is below 30.00, it is oversold.
On December 2, the RSI on the XRP/USD daily chart reached 96.25, indicating that it was overbought. This also coincided with a local high for the token.
At the time of writing, this XRP price analysis shows that the reading has fallen below the neutral 50.00 region, indicating that the momentum around it is now bearish. Since trading volume is also declining, XRP is likely to continue falling below $2.34 in the near term.
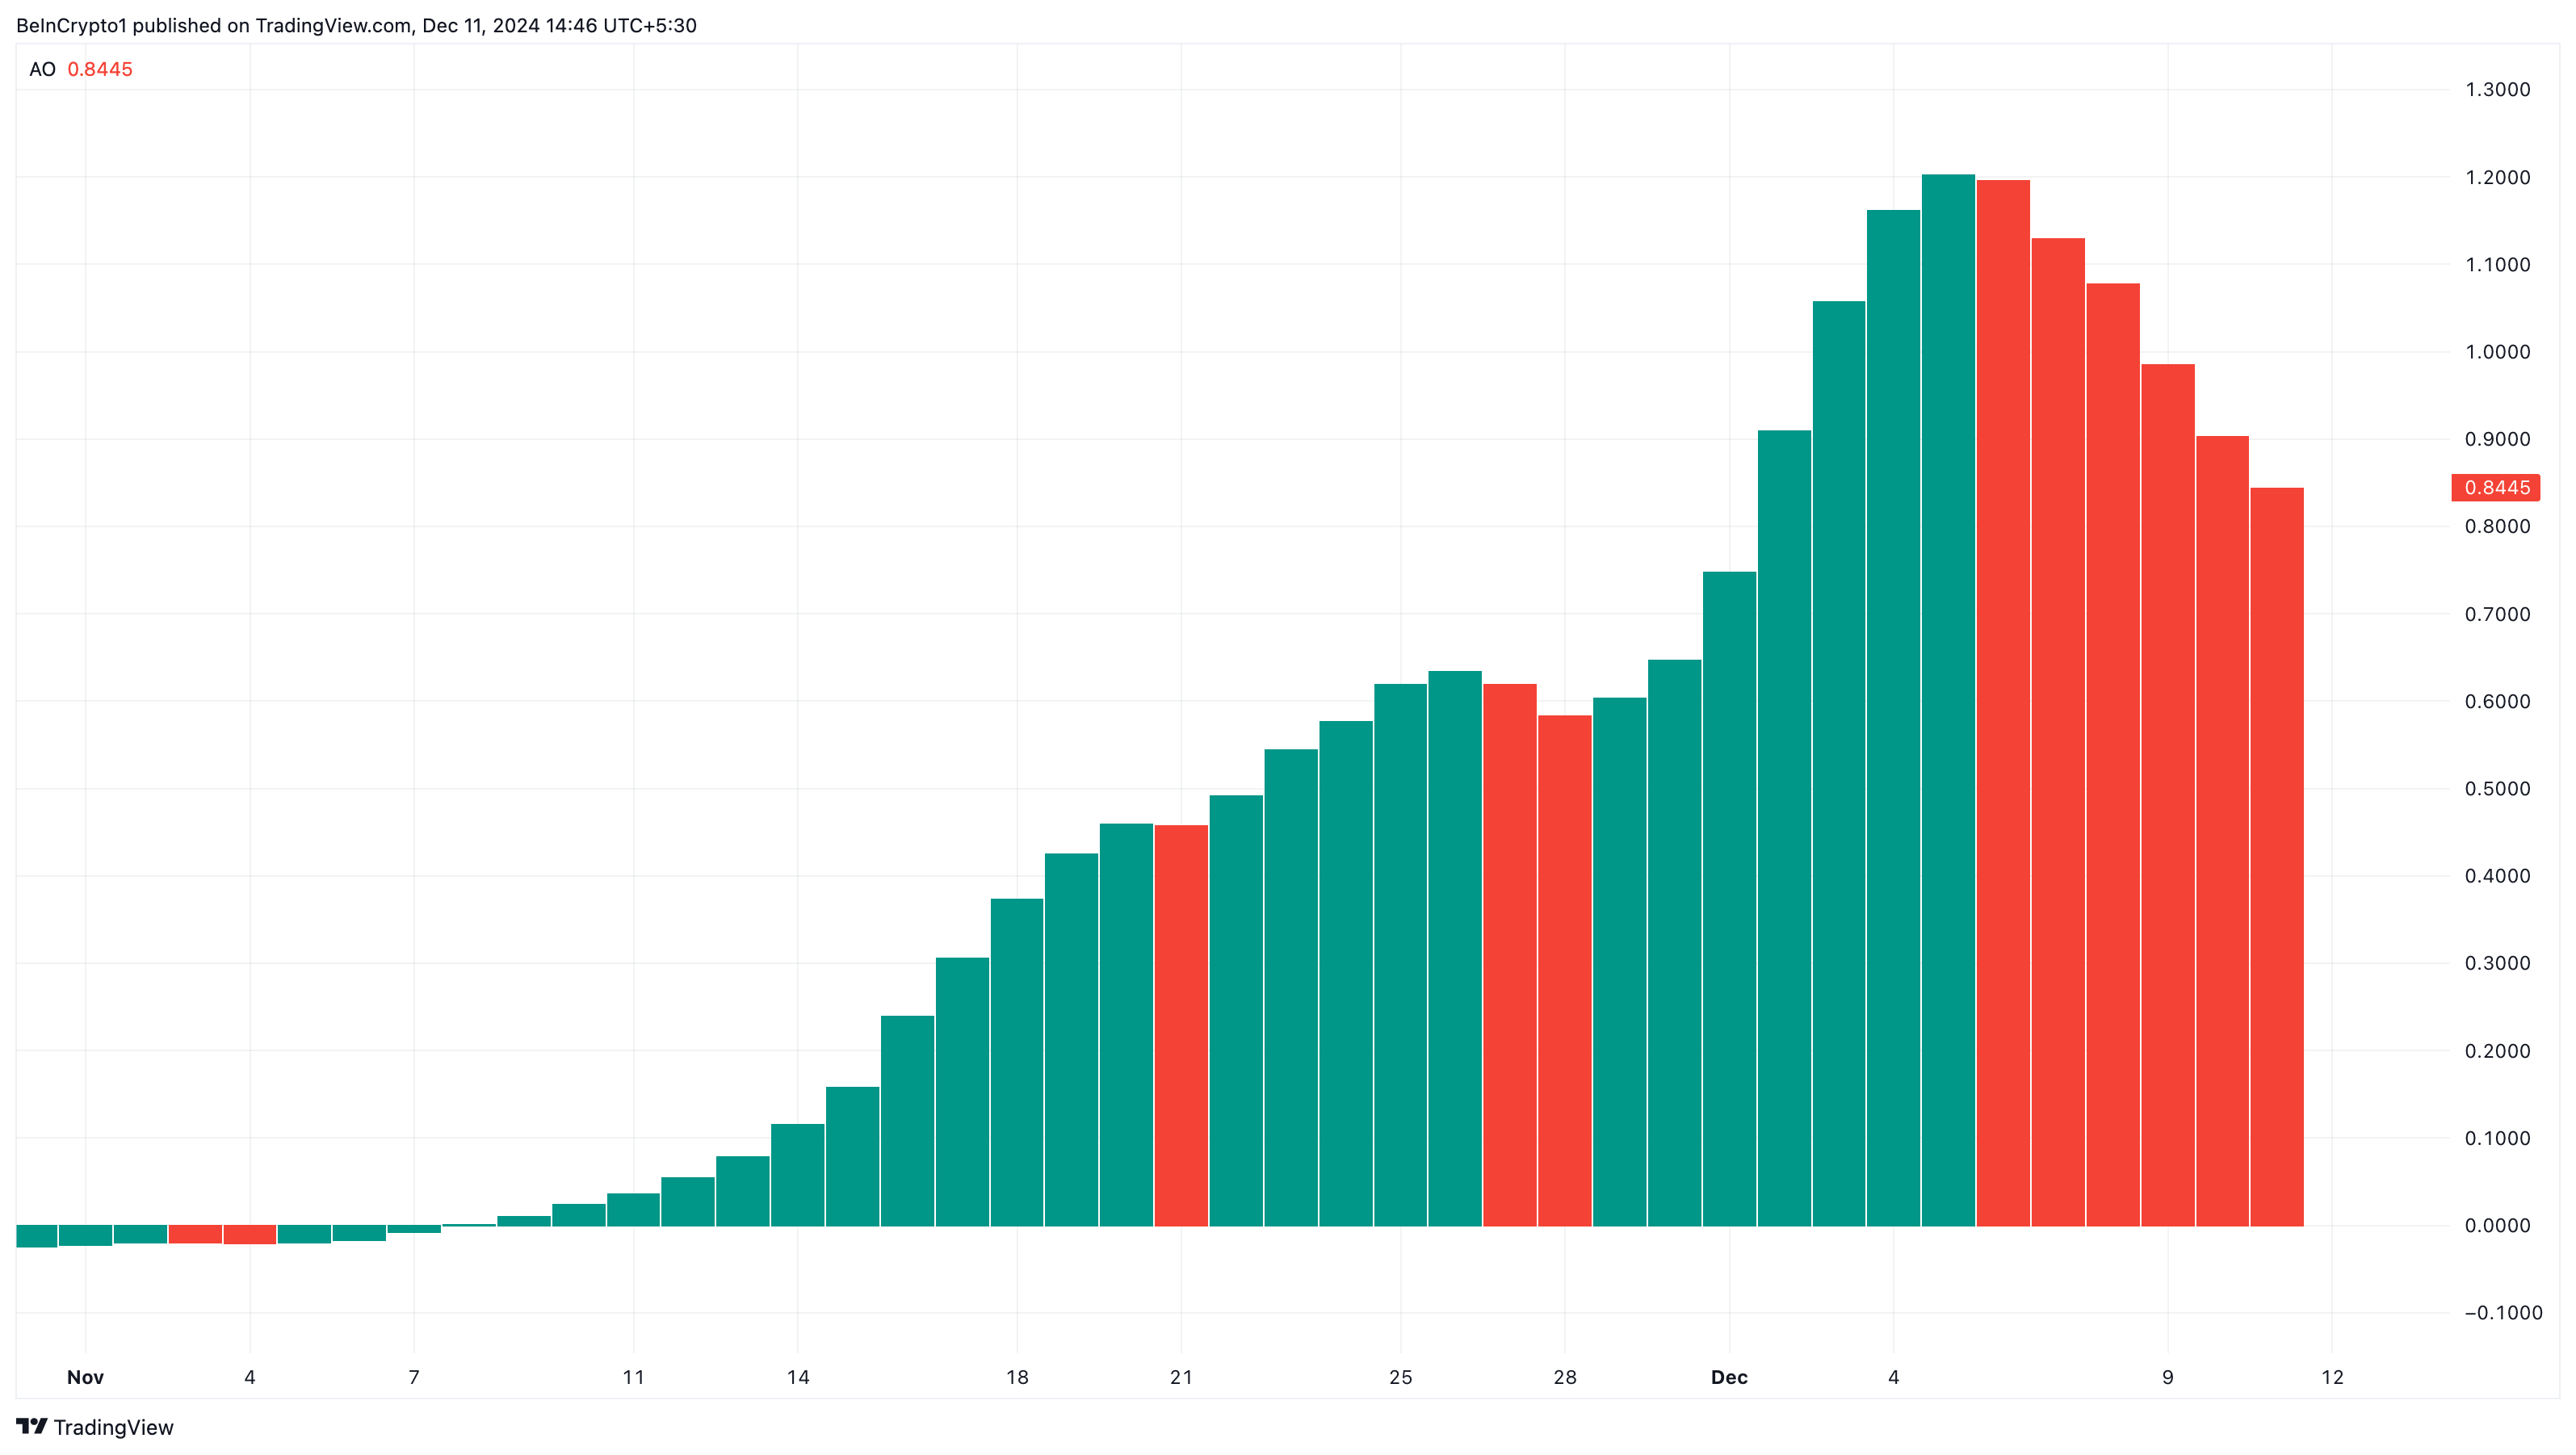
Beyond the RSI, the Awesome Oscillator (AO) is another indicator that suggests that XRP could fall below the current threshold. The AO is a momentum indicator that compares recent market movements to historical trends.
It uses a zero line in the center, with price movements plotted on either side based on the comparison of two different moving averages to test whether the momentum is bullish or bearish. When the AO is positive, the momentum is bullish and bearish when the indicator reading is negative.
At press time, the AO is positive. However, the indicator has shown red histogram bars, suggesting that the bullish momentum around the altcoin is fading.
XRP Price Prediction: Lower Lows
On the 4-hour chart, XRP has formed a head and shoulders pattern. This pattern is a classic bullish to bearish reversal formation. It consists of three peaks: a left shoulder, followed by a higher peak (the head) and then a lower peak (the right shoulder).
A “neckline” is drawn connecting the lowest points of the two channels. The slope of the neckline can be up or down. However, a downward slope typically indicates a more reliable reversal.
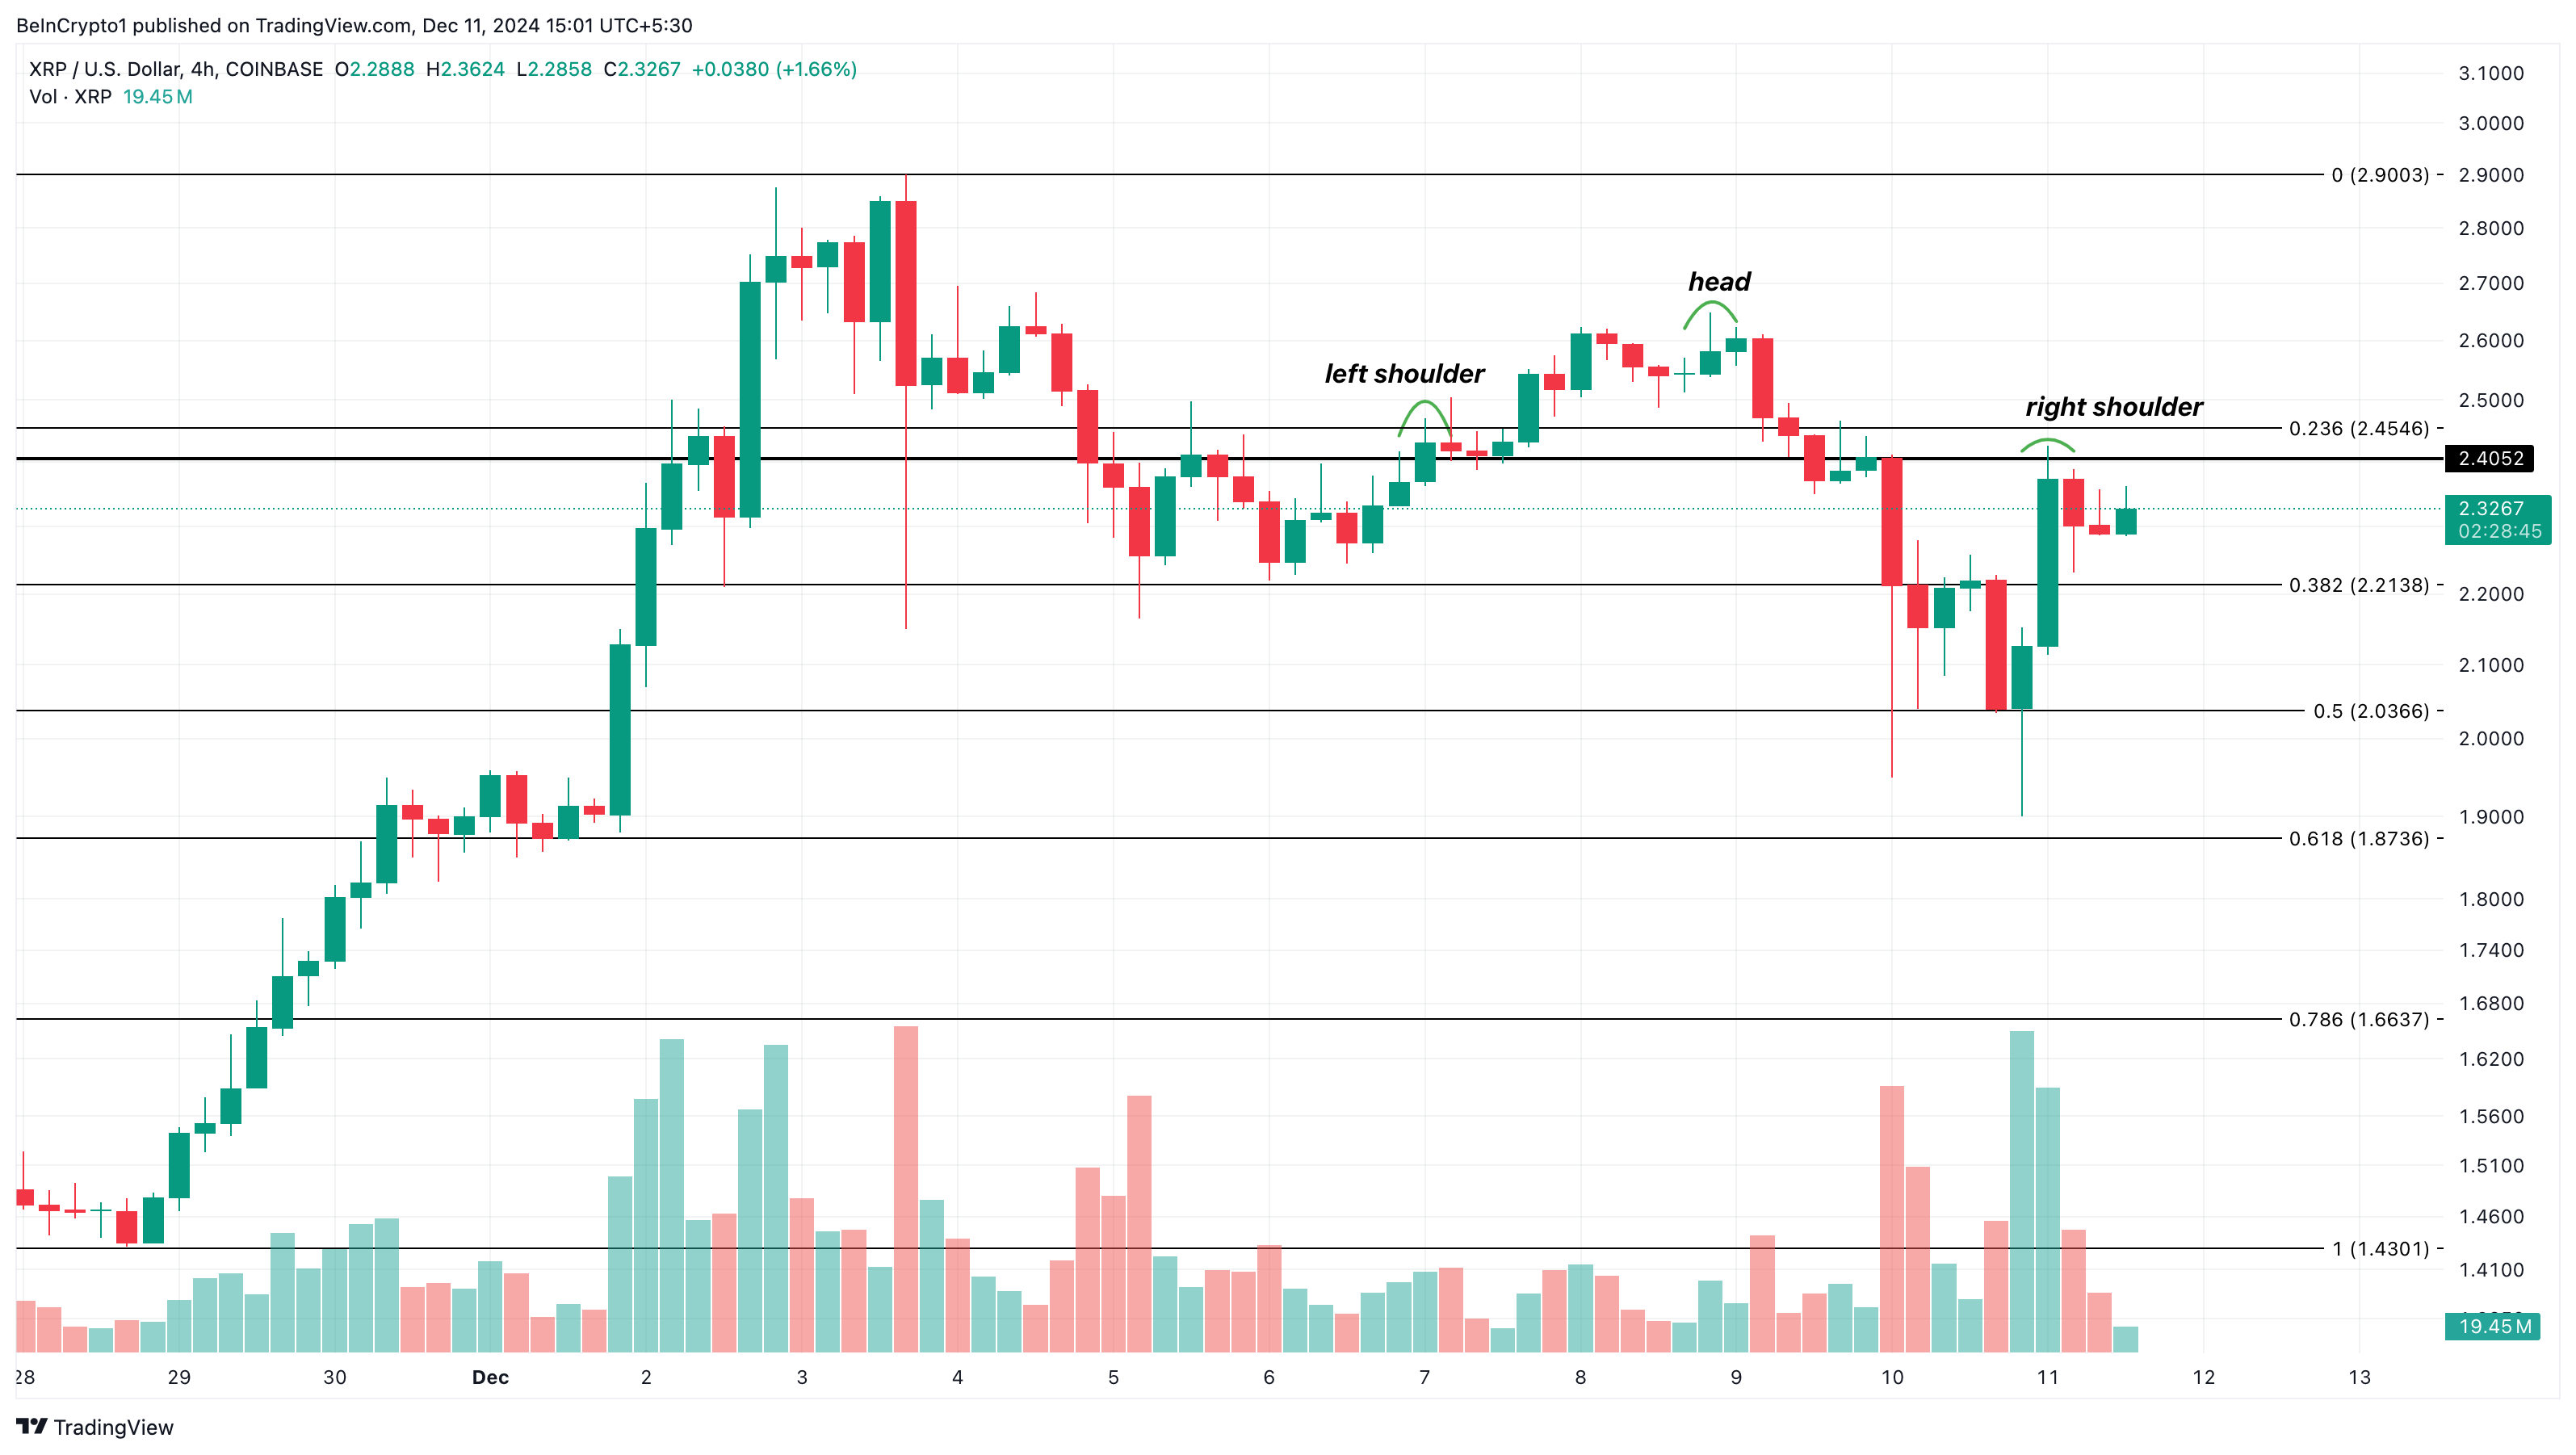
As seen below, XRP price has fallen below the neckline at $2.40, indicating weak buying. If the bulls fail to reverse this trend, then the token risks falling to $1.87. However, if buying pressure increases, XRP could rise to $2.90.
Disclaimer
In accordance with Trust Project guidelines, this price analysis article is for informational purposes only and should not be considered financial or investment advice. BeInCrypto is committed to providing accurate and unbiased reporting, but market conditions are subject to change without notice. Always do your own research and consult with a professional before making any financial decisions. Please note that our Terms and Conditions, Privacy Policy and Disclaimers have been updated.
