


This article is also available in Spanish.
Dogecoin (DOGE) has entered a period of weakness, falling approximately 16% from its Nov. 23 local high of $0.4795. As the original meme cryptocurrency struggles to regain key technical levels, the consensus among some analysts is that DOGE’s ability to stabilize or recover may depend almost entirely on an external factor: Bitcoin’s trajectory.
Dogecoin price at risk of another drop
Technical analysis suggests that the previously respected bullish trend line, established in mid-November, has now become a formidable barrier. After breaking this support line earlier in the week, Dogecoin bulls attempted several times to push the price back above it. However, none of these efforts have been successful.
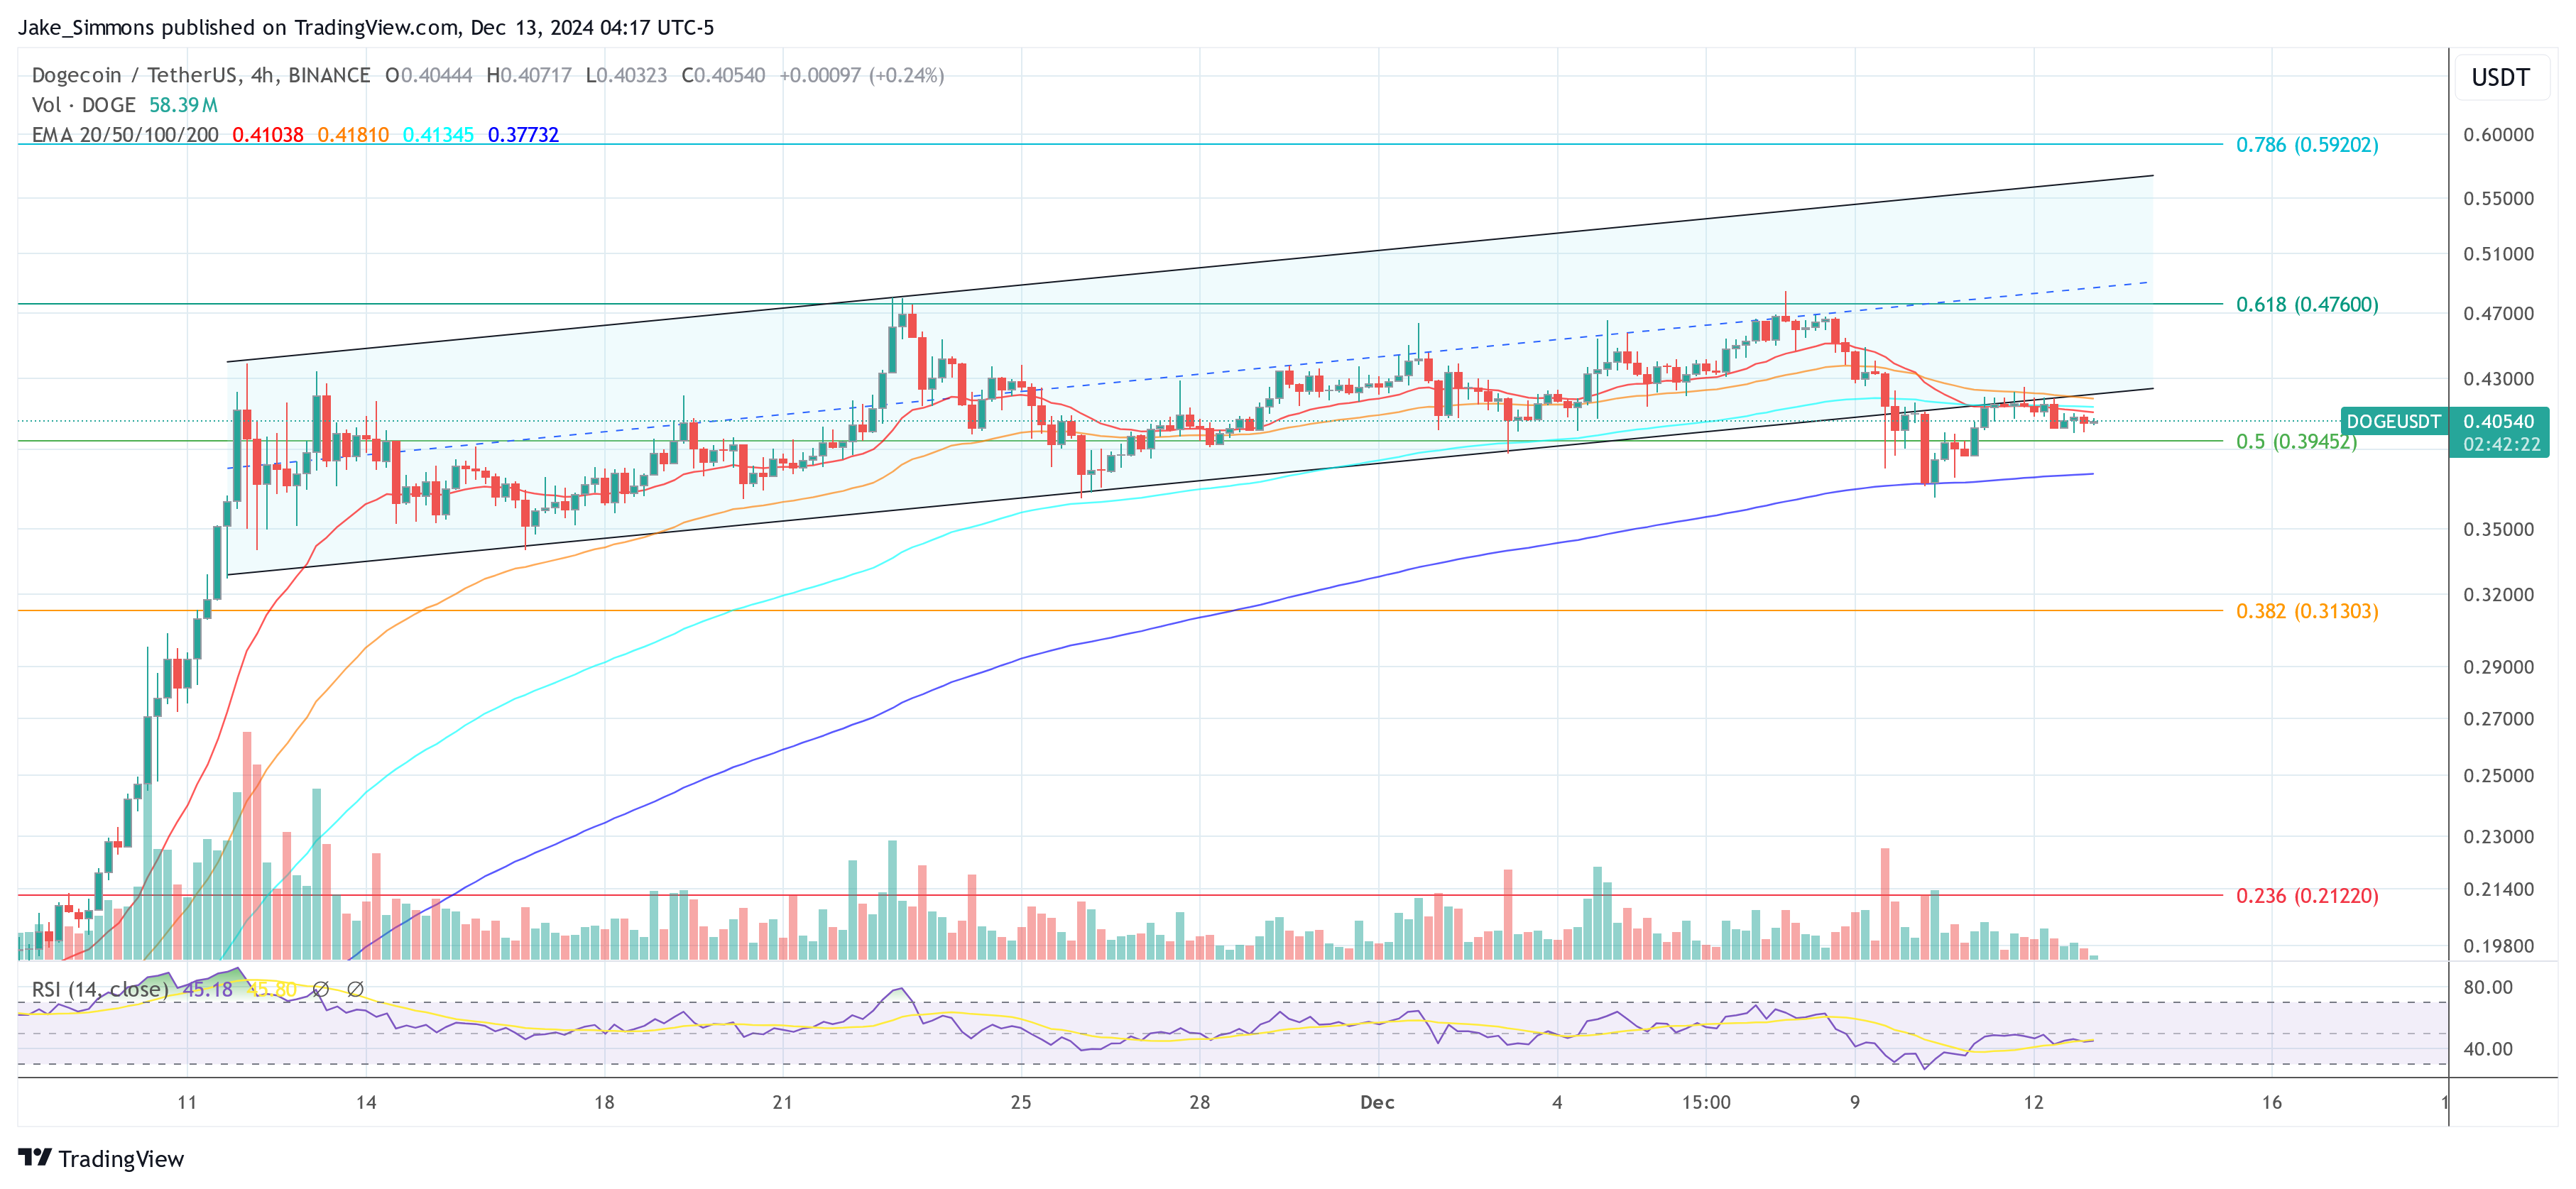
Cryptoanalyst Kevin (@Kev_Capital_TA), who has been closely following the 1-day chart of DOGE/USD, notes that DOGE is “being rejected from the retest of this trend line that we held for almost a month, plus it is right in the macro “. 786 Fib.”: A technical zone often associated with important turning points and possible reversals.
Beyond the trend line, internal momentum indicators paint a challenging picture. Kevin emphasizes that DOGE’s daily MACD is showing “strong downward momentum,” a technical signal that suggests the market’s short- and medium-term bias may tilt to the downside unless the broader crypto environment changes.
Related reading
In his opinion, “It is safe to say that without a BTC move higher, the most likely move for DOGE in the short and medium term is minor. However, a BTC move higher could save us.” It identifies $0.32 (the origin of the previous uptrend line) as the main downside target. If DOGE fails to hold above that level, traders can look towards the $0.29 to $0.26 range as possible next stops.
In another post on X, Kevin emphasized that Dogecoin price is stuck between two critical long-term Fibonacci levels. He describes DOGE as currently “trading between the golden macro pocket,” around $0.47, and the 0.5 Fib macro level near $0.39. According to him, a firm break above or below these fundamental levels could trigger what he calls a “cascading” effect of “aggressive movement.”
He adds: “My position is that DOGE is not in control of itself and its fate is solely in the hands of BTC at the moment, so focusing too much on the asset is kind of a waste of time. I don’t see anything telling me the cycle is over, so this should go up soon enough regardless of the near-term noise. There’s nothing more to do than sit and wait if you’re a long-term starter who came in early like me.”
However, there is at least one positive side worth noting. Kevin mentions that he is “following [a] potential hidden bullish divergence” on the DOGE daily chart. Hidden bullish divergences occur when price action continues to trend upward for a longer period of time, while momentum indicators such as the Relative Strength Index (RSI) trend downward.
Related reading
Sometimes this pattern can indicate that the underlying strength of a market is greater than it appears. It is, as the analyst says, “a nice textbook” at the moment, although it still needs significant help from Bitcoin. “I still need BTC to cooperate, so nothing is guaranteed,” says Kevin.
What about Bitcoin?
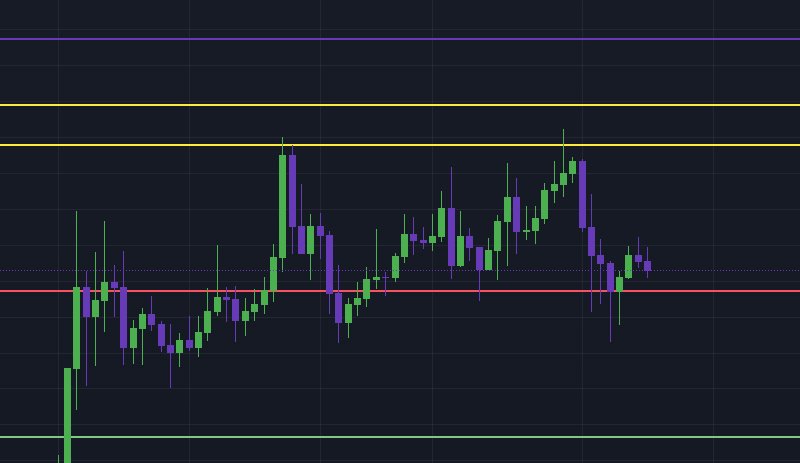
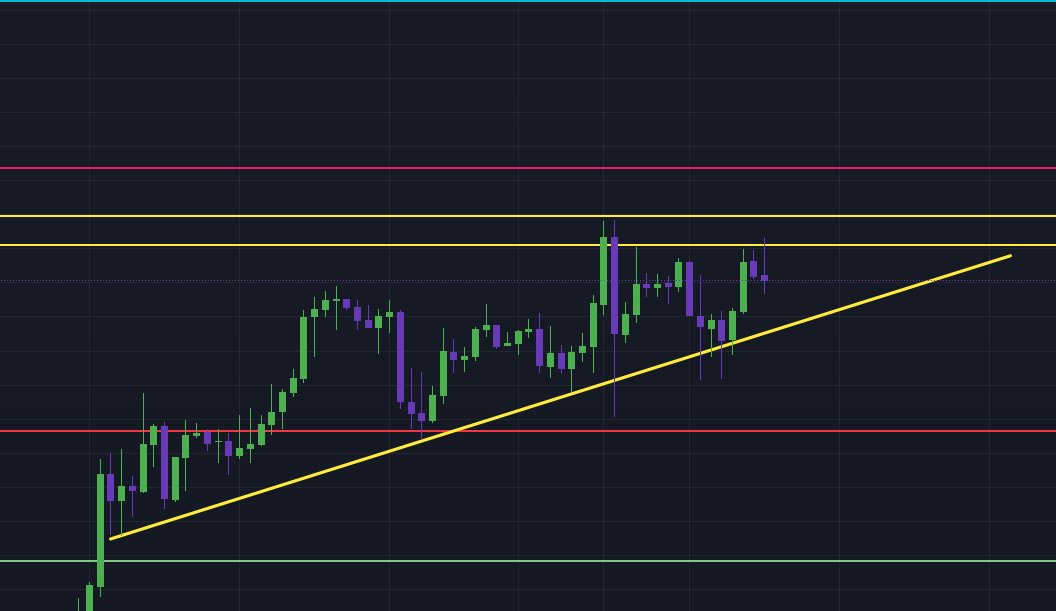
Kevin notes that Bitcoin is currently “compressing” between an uptrend support line and a macro gold market, levels derived from the previous bull market high to the bear market low. This tightening price action suggests an imminent resolution – BTC is unlikely to remain compressed in this zone for much longer. A decisive breakout, in either direction, appears imminent and could have far-reaching consequences. “This upward consolidation cannot last much longer. Very soon we will have failure in either direction,” Kevin predicts.
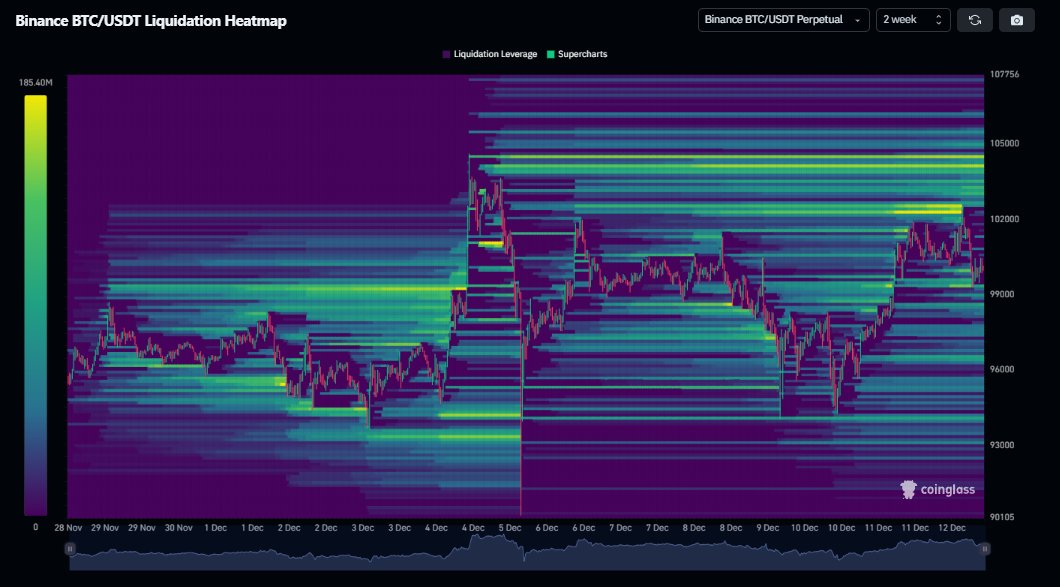
On the liquidity front, Kevin sees significant blocks of liquidity to the upside for BTC, noting that the “accumulated liquidity” over the past 48 hours aligns with the 1.703 macro Fibo level. He also mentions observational data showing that whales are buying large options on MicroStrategy (MSTR) stock. Such purchases may reflect anticipation of a BTC move higher, given MicroStrategy’s well-known Bitcoin treasury holdings. If these whales and liquidity indicators are correct, and BTC does indeed rise, DOGE could find the “one lifeline” it needs to stabilize and reverse its current downtrend.
At press time, DOGE was trading at $0.405.
Featured image created with DALL.E, chart from TradingView.com
