


This article is also available in Spanish.
In a technical analysis shared by crypto analyst Bobby A (@Bobby_1111888) on X, the analyst projects that XRP will potentially reach the $15 mark in this bull run, depending on the alignment of historical price movement patterns. The analysis delves into XRP’s past market cycles, applying percentage-based extrapolations and chart pattern evaluations to forecast future price trajectories.
Is a $15 XRP price realistic?
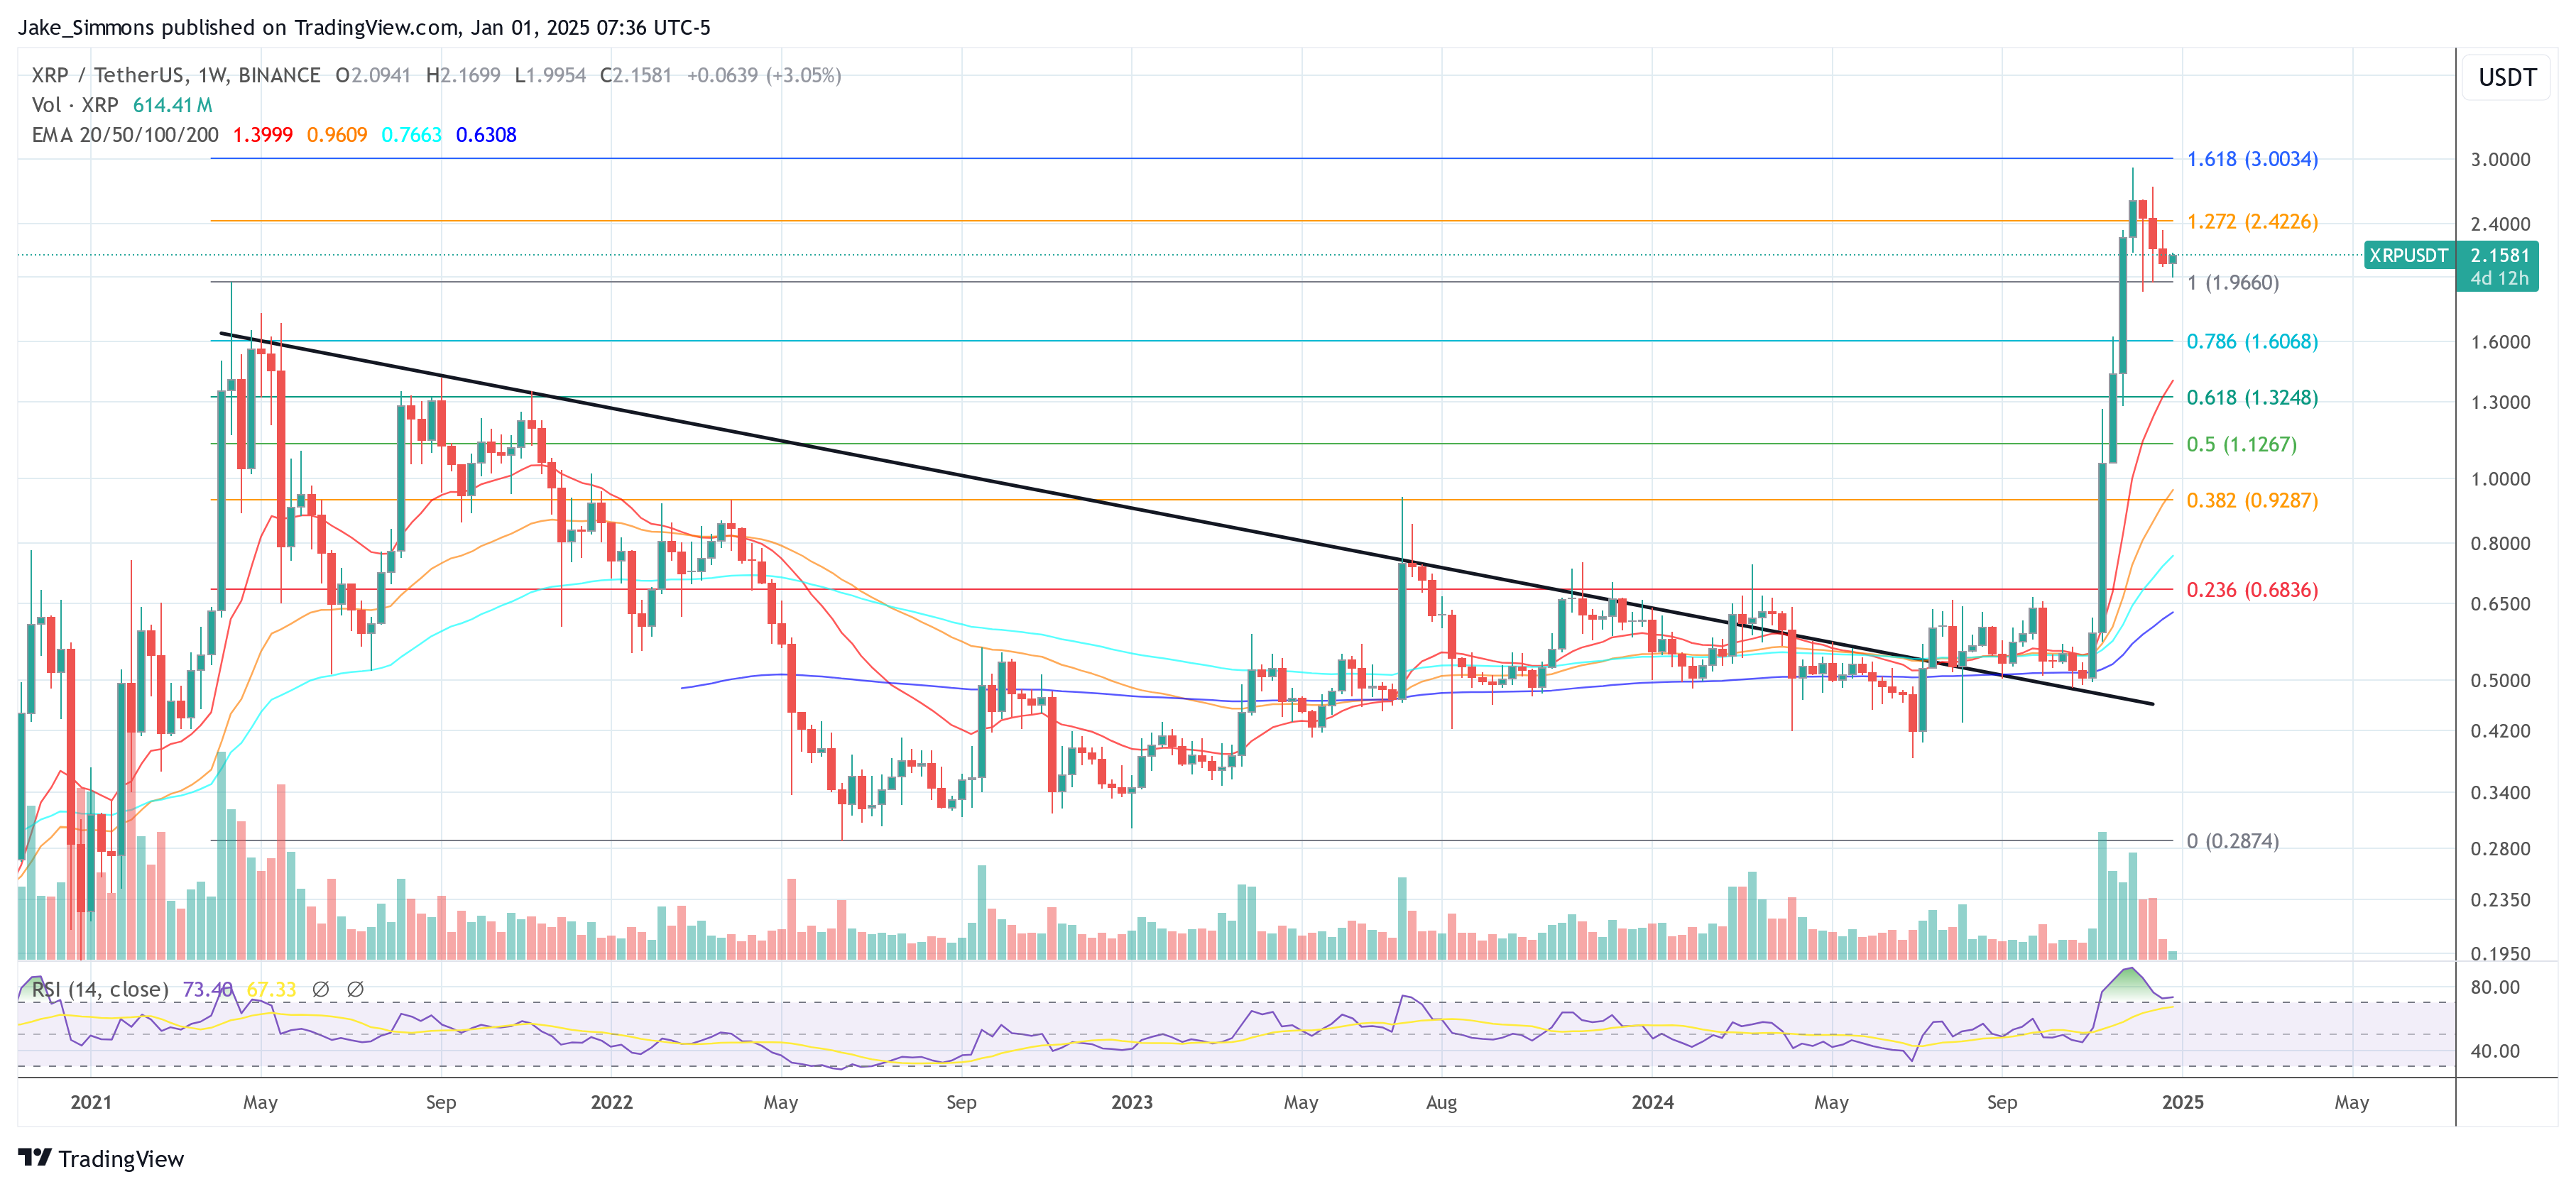
Bobby A’s analysis juxtaposes XRP’s performance during its 2017 market cycle with its current 2024 trajectory. Since the breakout of the range high in 2017, marked by a horizontal black dashed line on the chart, XRP experienced an initial appreciation of 629%.
In comparison, the asset has appreciated approximately 331% since its range-high breakout in 2024. Extending further back from the December 2014 high to the May 2017 peak, approaching the 4.236 Fibonacci extension, XRP experienced a staggering 1,330% increase.
Related reading
Applying the principle of halving percentage point increases, as seen since the initial surge in 2017, Bobby A posits that XRP’s next push could result in a 665% increase. This calculation positions XRP at approximately $15.00 near the 4.236 Fibonacci extension level.
“XRP appears to be cutting its percentage point gains in half compared to its 2017 market cycle. If asset price at approximately ~$15.00 near its 4.236 extension after a possible 665% increase,” explains Bobby A.
Notably, the analyst also notes a bullish flag pattern developing, a continuation pattern that typically indicates the potential for further bullish movement. This bullish flag points to the upper boundary of XRP’s parallel macro channel, estimated around the $10.50 price level. “The current bull flag the asset is forming is targeting the top of its parallel macro channel near $10.50,” notes Bobby A.
Related reading
Another analyst, bassii (@cryptobassii), responded with a contrasting point of view focusing on fractal analysis. Bassii posits that the ongoing rally may shrink by 42%, projecting that the price of XRP will approach $9, followed by a significant drop.
He delves deeper into fractal patterns and states: “This run looks to go down to 42%, would get us closer to $9 and then a big drop. But we are missing the last part of the 2017 race, IF (big if) that happens, and we keep the same percentage, we get about $30 after months of accumulation.”
Or even $35?
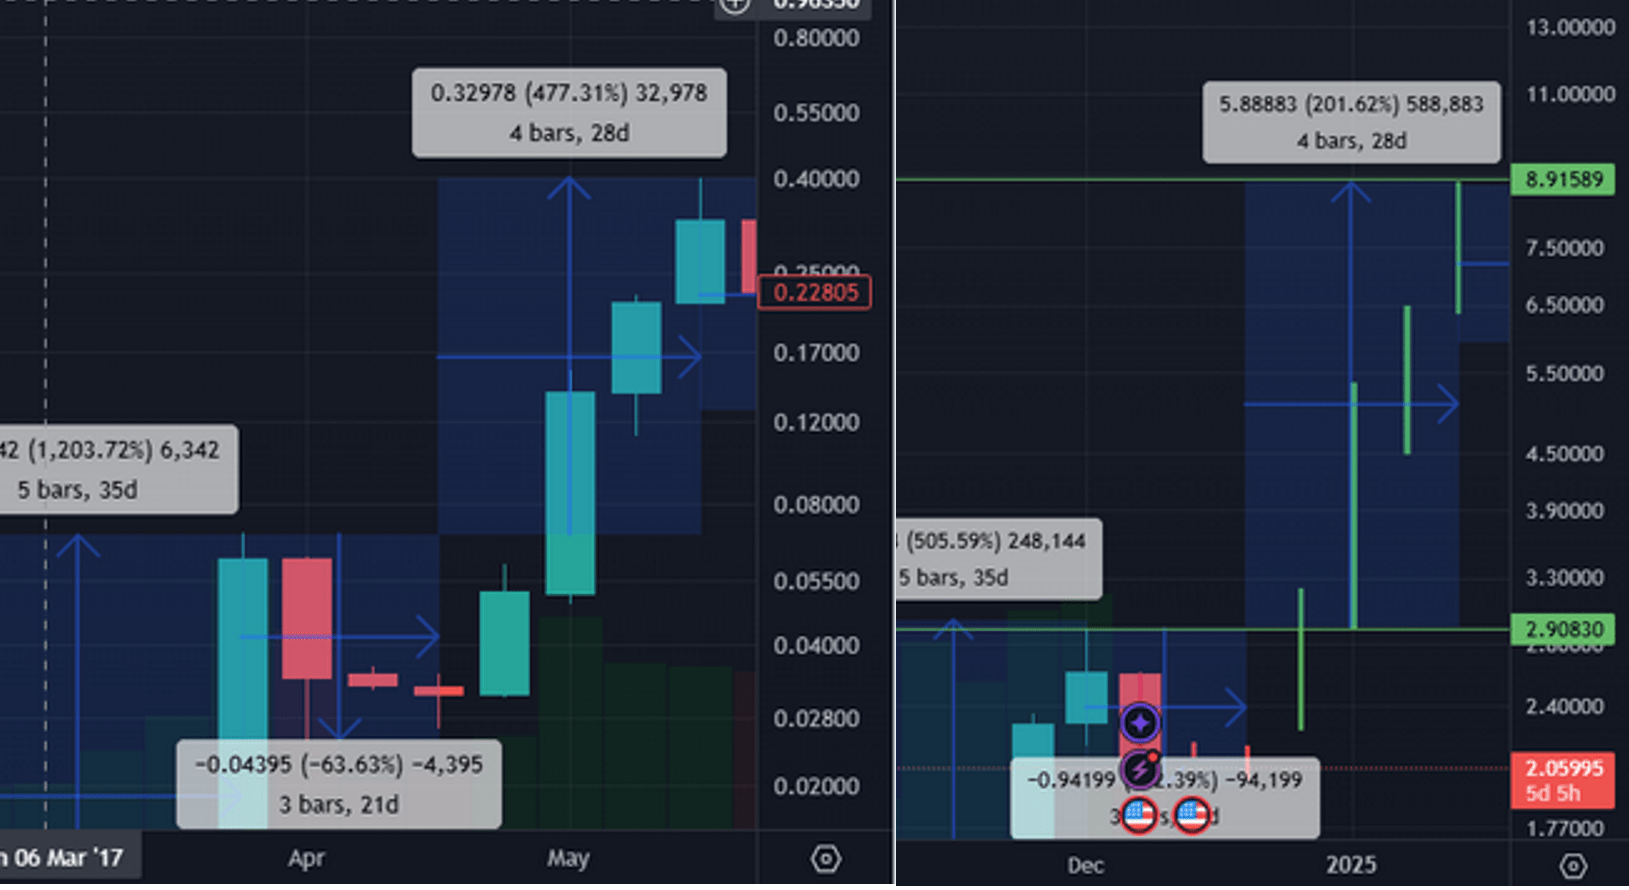
Bassii referred to a previous analysis of himself where he emphasized the similarities between the 2024 run and the 2017 cycle. Notably, both periods exhibit five weeks of consecutive green candles, although with different magnitudes: approximately 500% in 2024 compared to 1200% in 2017 .
He notes: “2017: 5 weeks of green candles at ~1200%^, followed by 3 weeks of red candles with a 63% drop. 2024: Also, 5 weeks of green candles with a ~500% increase (~1/2 of the 2017 run), followed by… (so far) 1 week of red candles by how much? You guessed it… 30% off.” Subsequent correction phases also mirror each other, with XRP experiencing a 30% drop in 2024 compared to a 63% drop in 2017, each roughly halving in magnitude.
Based on this, Bassii outlines possible future moves based on historical patterns, suggesting that if XRP continues to follow these fractal patterns without significant breakouts, it could accumulate for several months and potentially rise to $30 by September 2025.
Responding to Bassii’s analysis, Bobby A expresses cautious optimism, saying, “Yes, but I’m not sure the last push is coming. In the next one I have much more confidence.” Bassii complements this by highlighting the importance of sticking to fractal patterns and real-time chart evolution, adding: “I think it will depend on how closely we follow the fractals and what the chart tells us during this next run. Until now it is followed very closely. The weekly candles for the last 8 weeks have followed each other beat by beat. I’m not a moon boy, I know how crazy $30-$35 sounds. But we are still following the 2017 race.”
At press time, XRP was trading at $2.1581.
Featured image created with DALL.E, chart from TradingView.com
